Tenovos Connect job reports
Did your recipe throw an error instead of completing successfully? Not a problem. The Tenovos Connect “Job Reports” records all jobs processed by a recipe, allowing you to view details about each job’s execution flow. This includes information on the steps executed and input and output data for each step, enabling you to analyze your recipe and identify and fix any errors.
Navigate to a recipe's job report
Each Tenovos Connect recipe has its own job report.
To find the job report for a recipe:
-
Navigate to your Tenovos Connect project.
-
Within your project, open the “Recipes” folder and then open your recipe.
-
Once you have the recipe open, click the menu item called Jobs.

-
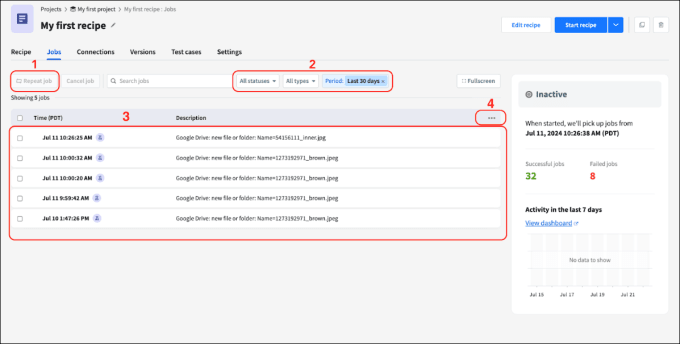
After clicking on jobs, you will see a history of the jobs this recipe has completed in the last 30 days.
Functionality within Job Reports
While viewing the “Job Reports” page, there are a handful of tools available that simplify job management and review.
-
Repeat Job. While viewing job reports, users are able to simply select jobs in the job history, then click Repeat job. Repeating a job will use the same trigger event as the first time the test was performed, but will always use the most recent recipe version.
-
Filter Jobs. Filtering jobs allows you to narrow down the jobs you are looking for by date period, job status (Successful, Processing, Failed and Canceled), and by job type (Repeated, Manually Tested and Auto Tested).
-
Job Details Table. Provides users with a centralized view of all job history and specific recipe information.
-
Customize Job History. Users are able to easily customize their job history on a recipe level. Customizing the job history table allows you to create an additional 10 columns in the table that will display specific recipe data.
NOTE: Custom columns will replace default description in the job report table. This data will be displayed for future test and production jobs.
To customize job history to add a new column to show an error message:
-
Click the kebab menu (three dots) on the top right hand corner of the job details chart. Click Customize job table.
-
Within Customize job table, you will see two fields—Column name and Column value.
-
Column name is where you will enter the name of the column in the job history table. For our example, let’s call this column “Error Message”.
-
Column value is where you will map the datapill for a recipe so that the job-specific data will show in the job history table. For example, if you mapped the “Error message” datapill from Step 6. Define error handling steps to this field. Your screen would look like this:

-
-
If your screen looks like the above, click Apply Changes to save your custom column.
Now, you should see the column Error Message where the column titled Description used to be.
Job details
When an active recipe processes a trigger event and runs its series of actions, it creates a job in the job reports table. To view specific details about a job that was run, you can click into the job from the job reports table. This will bring you to the job details page.
The job details page displays the input data and output data for each step in the recipe, allowing you to inspect the job step-by-step and debug it if required.
To view the job details page for a specific job:
-
Navigate to the Tenovos Connect recipe.
-
Click the Jobs tab and then click a job that you want to view to open the job details.
-
Once job details for the step are open, click on one of the recipe steps.
-
When viewing the step details, there are three ways to view the step data:
-
Step Input
The step input is the data that was passed into the step during the "setup" portion of building the recipe. -
Step Output
The step output is the data pills, and the relative data, that is being created by the step you are viewing. In other words, the output of a step are the data pills that you can use to pass data to subsequent recipe steps. -
Step Debug
- Allows you to view the recipe step in the highest level for detail.
- Contains the network trace of all the API requests that are performed as part of the recipe step. This allows you to inspect the headers, the raw payload data, and the response of each API request that is made.
-